Few questions have generated fiercer
discussions in the scientific community than those related to intelligence and
intelligence testing (see blog: Increasing IQ: Why Bother?). The present blog which will appear in two parts (I: Psychometric and II:
Neurobiological evidence) is about gender differences in general intelligence. As stressed by Nyborg (1994), this topic has been
characterized by a minefield of methodological and theoretical problems. It is
also a sensitive subject matter, packed with ideology and concern over political correctness. As a result, test constructors have calibrated their
instruments to conform to gender equality views. Certain test items were
removed, so that the test no longer showed a gender difference in overall
intelligence (Wechsler, 1981; Vogel, 1990). Some recent findings,
indicating that males outscore females by about 3.8 IQ points (Lynn et al.,
2004;
Irwing & Lynn, 2005; Jackson & Rushton, 2006; Nyborg 2015), are therefore puzzling and
difficult to explain. Is the difference even greater? Have the test constructors
done a bad job?
Nyborg (2005, p.507) concluded that: “Proper methodology identifies a male
advantage in g that increases exponentially at higher levels, relates to brain
size, and explains, at least in part, the universal male dominance in society”.
We are aware that this is just a limited view
of sex differences. As stressed by de Vries and Forger (2015), sex differences in the brain are not separable
from sex differences in other body parts. Women may see things differently, but
they are also perceived and differently treated by the world creating different
knowledge and experiences which might have profound consequences for the brain.
Psychometric evidence – g
As stressed in the brief introduction, it is
unlikely that psychometric evidence could ever provide a definitive answer to
the question of the present blog. Ackerman (2006, p.722) noted: “... whether males
or females have higher mean general intelligence depends on the
operationalization of the content of the tests selected to assess cognitive
ability.”
Even more numerous are
methodological problems related to sample selection and the methods used to
establish sex differences. In particular the method of correlated vectors has
been criticized suggesting that multi-group confirmatory factor analysis is a
better option (Irwing, 2012).
A detailed review of the literature is beyond the scope of this blog, therefore
we will provide just two examples of more recent findings related to sex
differences in intelligence exemplifying the aforementioned problems.
Lynn (1999) proposed a developmental
theory in order to explain sex differences in mean performance on measures of
general intelligence. Briefly, the theory states that girls mature more rapidly
in brain size and neurological development than boys up to the age of 15 years.
Faster maturation of girls up to this age compensates for their smaller brain
size resulting in little or no sex differences in intelligence. From the age of
16 years onwards, the growth rate of girls decelerates, which may explain a
male advantage of about 4 IQ points that is consistent with larger average male
brain size.
To test this hypothesis, Savage-McGlynn (2012) used multi-group confirmatory
factor analysis to assess mean differences in younger (7–14 years) and older
(15–18 years) groups of individuals. The groups were taken from a nationally
representative sample of children from 85 schools and colleges across the UK
with a sample of 663 younger (323 male) and 263 (114 male) older participants. The
participants were invited to participate in the standardization of Raven’s
Standard Progressive Matrices Plus. The analysis led Savage-McGlynn
(2012, p. 139) to conclude: “…the current
investigation failed to find significant mean sex differences between groups of
male and female participants younger than 15 or older than 15 years of age”.
Another study that investigated sex differences
in g was performed by Irwing in 2012. Multi-group factor analyses
were used to analyze the American standardization sample of the WAIS-III, which
consists of 2450 individuals aged from 16 to 89 years. Sample sizes differed for full-scale IQ scores (603 males; 696
females), and for specific factors of Verbal Comprehension, Perceptual
Organization, Working Memory, and Processing Speed (1174 males; 1303 females). The
analyses performed by Irwing (2012) showed a sex difference favoring men in g (0.19 – 0.22d), Information (0.40d),
Arithmetic (0.37–0.39d), Symbol Search (0.40 – 0.30d), and a sex difference
favoring women in Processing Speed (0.72 – 1.30d). These differences were only significant
for main effects of sex but not for age nor for interaction effects. Irwing’s
conclusion (2012, p. 131) involved the statement: “…our findings provide further support for Lynn’s developmental theory
of sex differences, and suggest that the consensus view that there is greater
male variability in cognitive abilities requires further investigation.”
Although both studies used similar methodology,
they provided contradictory findings. At first glance, the most obvious reason might
be the different tests used to determine g.
Irwin’s (2012) study used WAIS-III whereas Savage-McGlynn’s (2012) study used
SPM+. One might expect different outcomes particularly because WAIS-III lacks 3-D
mental rotation tasks, and because items that showed excessive sex differences
were eliminated in the construction process. Yet another explanation was put
forward by Irwing (2012). Because sex
differences were most attenuated between the ages 28 to 60 years (even showing
a reverse pattern at age 40, female IQ > male IQ), and because this age span
corresponds with the time period that is crucial for professional success, therefore
it could be speculated that successful males (being more engaged with their
professional career than females) might have been less inclined to participate
in standardization studies than intelligent women. All these factors could have
led to an underestimation of sex differences in g. One could also argue that research on intelligence-related sex
differences is limited by its exclusive reliance on IQ tests.
Psychometric evidence – specific abilities
Similar methodological issues have been
reported for studies focusing on sex differences in spatial, mathematical, and
verbal abilities. A meta-analysis of studies published before 1973 found an
average difference of about half a standard deviation in favor of males on
tests of visuo-spatial ability (Hyde, 1981). Most pronounced gender
differences of nearly one standard deviation have been reported for mental
rotation tasks (Mackintosh & Bennett, 2005). These findings were
confirmed in a more recent large scale study including 90,000 females and 111,000
males from 53 nations (Lippa et al., 2010). The results showed
significant male advantages in mental rotation (d = .47) and line angle judgment
(d = .49). A meta-analysis of mental rotation tasks showed that sex differences
increased when the tasks were presented under time constraints (Voyer, 2011). The duration of time limits
did not influence the results; the difference was only observed between test
conditions with a time limit of any duration and those without a time limit.
Due to their relevance for education, sex
differences in mathematical and verbal abilities have recently received a great
deal of attention. A comparison of students’ mathematical and reading abilities
in different time periods led to the conclusion that the gap between boys and
girls has disappeared (Hyde, 2014;
p. 381): “Overall, then, it appears that
girls have reached parity with boys in mathematics performance, at least in the
United States”. Based on the same
scientific evidence it was further concluded (Hyde, 2014; p. 382): “If there is a female advantage in reading
comprehension and other verbal skills, it is a small one.”
The question is whether such conclusions can be
made based on the evidence provided?
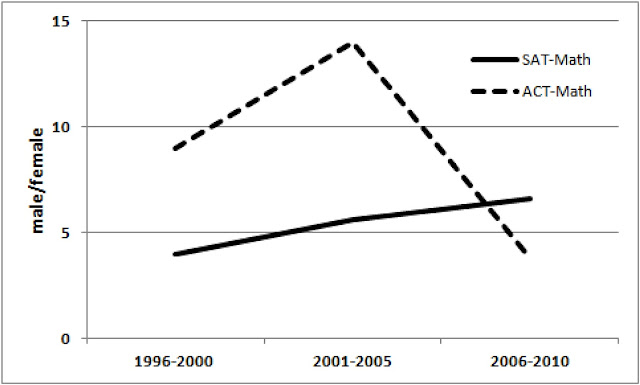
The most commonly reported evidence for the
diminishing gender gap in mathematical ability stems from the study by Wai et al. (2010). The study analyzed male/female ratios
in mathematical reasoning based on SAT-Math and ACT-Math test batteries in 5
years intervals from 1981 till 2010 (SAT) and from 1990 till 2010 (ACT). The
most striking finding was a drop from a 13.5:1 ratio (13.5 boys for every 1
girl) in the top 0.01% level of SAT-Math performance observed in 1981 to a 3.55
ratio observed in 2001, which remained unchanged for the last 10 years of the
studied interval. However, what has been most often ignored is the fact that the
ratio of perfect SAT-math scorers increased from 1996 onwards, while no obvious
trend can be seen in the perfect scorer data for the ACT-Math (see figure below).
Another problem suggested by Lakin (2013) was that the selection procedures
used in the Wai et al. (2010) study might have been biased. The sample was based
on volunteers who participated in additional testing for the opportunity to be
selected for a summer enrichment program. This might have had an unforeseen
influence on the motivation of the respondents.
Yet another problem that is common to all psychometric approaches is test selection. Using a different test often changes the study
outcome, although both tests are assumed to measure the same trait. For instance, Lakin (2013) examined sex
differences in verbal, quantitative, and nonverbal reasoning abilities in US
students as measured by the Cognitive Abilities Test and reported: “The most surprising finding was that,
contrary to related research, the ratio of males to females in the upper tail
of the quantitative reasoning distribution seemed to increase over time” (p.
263).
The difficulty with task selection was further highlighted
by Hyde and colleagues (2008), who attempted to gain
better insight into gender differences in mathematical ability by classifying
task items into four levels. Level 1 only required recall of facts and
performing easy algorithms whereas level 4 contained items that required
complex reasoning over extended time periods (i.e. the students were required
to connect ideas to develop alternate approaches). The analysis could be
performed only partially because none of the test items could be classified as
a level 4 item.
Perhaps one of the first written accounts of
female superiority in verbal ability is found in an ancient Sanskrit book,
suggesting that nine shares of speech were given to women and one to men
(Nyborg, 1994). Systematic analyses have
shown that females surpass males in some, but not necessarily all areas of
verbal ability (Halpern, 2004). Specifically, females seem to have an
advantage in episodic memory tasks where verbal processing is required or can
be used, as well as in verbal fluency (Maitland et al. 2004). A recent study analyzed
data collected by PISA (10 years of data collection), which included mathematic
and reading performance of nearly 1.5 million 15 year olds in 75 countries, showed
that: “the average sex difference in
reading was three times larger than the sex difference in mathematics. Not only
was the sex difference in reading relatively large, the overall average
difference increased from 32.0 points in 2000 to 38.8 points in 2009” (Stoet
and Geary, 2013;
p. 2). Ten points are approximately 1/10th of a standard deviation.
Therefore, the assumptions based on the psychometric-trait
approach represent a more or less successful balance between “scientific rigor”
and “political correctness” as exemplified in the concluding remarks of two
recent review papers tackling sex difference in cognitive ability:
“The
gender similarities hypothesis states that males and females are similar on
most, but not all, psychological variables. The current review found much
evidence in support of gender similarities” (Hyde, 2014; p. 393).
“Importantly,
these findings describe group averages and therefore often have limited relevance
to understanding individual men and women. Many men excel in writing tasks and
many women excel in mental rotation tasks, even if group averages exist” (Miller
and Halperen, 2014; p.42).
Real-world intellectual success
Alternatively, data based on ecologically validated
measures of intellectual success in arts and sciences may provide insight into sex
differences in cognitive ability. The most prestigious award in science, medicine
and literature is the Nobel prize, followed by the Wolf prize granted in Israel
for Physics, Chemistry, Medicine, Mathematics, Agriculture and Art (music, architecture,
painting and sculpture).
Domain
|
Year
|
Female
S
|
Male
S
|
%
|
||
1901
– 1940
|
1941
– 2000
|
2001
– 2015
|
||||
Nobel Prize Laureates
|
||||||
Physics
|
1
|
1
|
0
|
2
|
199
|
1.0
|
Chemistry
|
2
|
1
|
1
|
4
|
168
|
2.3
|
Medicine
|
0
|
6
|
6
|
12
|
198
|
5.7
|
Economy
|
0
|
0
|
1
|
1
|
76
|
1.3
|
Literature
|
4
|
5
|
5
|
14
|
94
|
13.0
|
Wolf Prize Laureates
|
||||||
Physics
|
0
|
0
|
0
|
56
|
0
|
|
Chemistry
|
0
|
0
|
0
|
46
|
0
|
|
Medicine
|
4
|
1
|
5
|
49
|
10.2
|
|
The table above summarizes female laureates for
both prizes in physics, chemistry, medicine, and literature and economy (only
for the Nobel prize) from the first time it was awarded till 2015. Two assumptions
can be deduced. First, there is a clear difference in the number of female
Nobel laureates in literature compared to other domains, especially physics and
chemistry, which roughly corresponds with the reported male advantage in
mathematical reasoning and the female advantage in verbal ability. Second, the
data does not indicate that this difference decreased or has changed over the
last 100 years, since the first Nobel prize was awarded. A similar trend can
also be observed for the Wolf prize. Can all these be attributed to sociocultural
influence and male chauvinism? Probably not. The first female Nobel prize in
physics was awarded to Marie Curie
Sklodowska in 1903, and the second to Maria Goeppert Mayer in 1963. One can speculate that in 1903 and
even in 1963 there was much more gender inequality and “male chauvinism” and
much less pressure for “gender similarity” than today. Thus it seems that
scientific excellence was always recognized being male or female.
In the mathematical field, the three most prestigious
prizes are the Fields medal awarded since 1936 every four years to mathematicians
under 40 years of age at the International Congress of the International
Mathematical Union, the Wolf prize, and the Abel prize awarded since 2003 annually
by the Government of Norway. The only woman laureate is Maryam Mirzakhani, who
was awarded the Fields gold medal in 2014 (55 male laureates). The Abel prize
was awarded to 16 male mathematicians and the Wolf prize also exclusively to 55
male mathematicians.
Some insight into sex difference in mathematical ability can further be
obtained from the number of female mathematicians holding a full or emeritus
professor position at prestigious universities. The table below shows the
number of female/male full or emeritus professors at the 3 top Universities in
the US and Europe. The rankings are based on ARWU (Academic Ranking of World
Universities by subject
mathematics = M; and total = T; http://www.shanghairanking.com/ARWU2015.html).
US
|
Europe and UK
|
||||||||||||||||
Princeton
University
M = 1 T =
6
|
Stanford University
M =
2 T = 2
|
Harvard University
M =
3 T = 1
|
UPMC – Sorbonne
M =
5 T = 36
|
University of Oxford
M =
7 T = 10
|
ETH Zürich
M = 14 T = 20
|
||||||||||||
♂
|
♀
|
%
|
♂
|
♀
|
%
|
♂
|
♀
|
%
|
♂
|
♀
|
%
|
♂
|
♀
|
%
|
♂
|
♀
|
%
|
34
|
3
|
8.1
|
35
|
3
|
7.9
|
23
|
1
|
4.2
|
54
|
7
|
11.5
|
27
|
6
|
18.2
|
23
|
0
|
0
|
The male to female ratios range from 4.5 for
Oxford to 23.0 for Harvard, whereas ETH Zürich has no females in the highest academic rank. These frequencies confirm the trends observed in the right tale of the
normal distribution pointing to a male advantage in mathematical ability.
References
Ackerman, P. L. (2006). Cognitive
sex differences and mathematics and science achievement. American Psychologist, 61(7), 722–723. http://doi.org/10.1037/0003-066X.61.7.722
de Vries, G. J., & Forger, N. G. (2015). Sex differences in the
brain: a whole body perspective. Biology of Sex Differences, 6(1). http://doi.org/10.1186/s13293-015-0032-z
Halpern, D. F. (2004). A
Cognitive-Process Taxonomy for Sex Differences in Cognitive Abilities. Current
Directions in Psychological Science, 13(4), 135–139. http://doi.org/10.1111/j.0963-7214.2004.00292.x
Hyde, J. S. (1981). How large are
cognitive gender differences? A meta-analysis using !w2 and d.. American
Psychologist, 36(8), 892–901. http://doi.org/10.1037/0003-066X.36.8.892
Hyde, J. S. (2014). Gender
Similarities and Differences. Annual Review of Psychology, 65(1), 373–398.
http://doi.org/10.1146/annurev-psych-010213-115057
Hyde, J. S., Mezulis, A. H.,
& Abramson, L. Y. (2008). The ABCs of depression: Integrating affective,
biological, and cognitive models to explain the emergence of the gender
difference in depression. Psychological Review, 115(2), 291–313. http://doi.org/10.1037/0033-295X.115.2.291
Irwing, P. (2012). Sex
differences in g: An analysis of the US standardization sample of the WAIS-III.
Personality and Individual Differences, 53(2), 126–131. http://doi.org/10.1016/j.paid.2011.05.001
Irwing, P., & Lynn, R.
(2005). Sex differences in means and variability on the progressive matrices in
university students: A meta-analysis. British Journal of Psychology, 96(4),
505–524. http://doi.org/10.1348/000712605X53542
Jackson, D. N., & Rushton, J.
P. (2006). Males have greater g: Sex differences in general mental ability from
100,000 17- to 18-year-olds on the Scholastic Assessment Test. Intelligence,
34(5), 479–486. http://doi.org/10.1016/j.intell.2006.03.005
Lakin, J. M. (2013). Sex
differences in reasoning abilities: Surprising evidence that male–female ratios
in the tails of the quantitative reasoning distribution have increased.
Intelligence, 41(4), 263–274. http://doi.org/10.1016/j.intell.2013.04.004
Lippa, R. A., Collaer, M. L.,
& Peters, M. (2010). Sex Differences in Mental Rotation and Line Angle
Judgments Are Positively Associated with Gender Equality and Economic
Development Across 53 Nations. Archives of Sexual Behavior, 39(4), 990–997. http://doi.org/10.1007/s10508-008-9460-8
Lynn, R. (1999). Sex differences
in intelligence and brain size: A developmental theory. Intelligence, 27(1),
1–12.
Lynn, R., Allik, J., &
Irwing, P. (2004). Sex differences on three factors identified in Raven’s
Standard Progressive Matrices. Intelligence,
32(4), 411–424. http://doi.org/10.1016/j.intell.2004.06.007
Mackintosh, N. J., & Bennett, E. S. (2005). What do Raven’s
Matrices measure? An analysis in terms of sex differences. Intelligence, 33(6),
663–674. http://doi.org/10.1016/j.intell.2005.03.004
Maitland, S. B., Herlitz, A., Nyberg, L., Bäckman, L., & Nilsson, L.-G.
(2004). Selective sex differences in declarative memory. Memory &
Cognition, 32(7), 1160–1169.
Miller, D. I., & Halpern, D.
F. (2014). The new science of cognitive sex differences. Trends in Cognitive
Sciences, 18(1), 37–45. http://doi.org/10.1016/j.tics.2013.10.011
Nyborg, H. (2015). Sex differences across different racial ability levels: Theories of origin and societal consequences. Intelligence, 52, 44–62. http://doi.org/10.1016/j.intell.2015.04.005
Nyborg, H. (2015). Sex differences across different racial ability levels: Theories of origin and societal consequences. Intelligence, 52, 44–62. http://doi.org/10.1016/j.intell.2015.04.005
Nyborg, H. (2005). Sex-related
differences in general intelligence g, brain size, and social status.
Personality and Individual Differences, 39(3), 497–509.
http://doi.org/10.1016/j.paid.2004.12.011
Nyborg, H. (1994). The neuropsychology
of sex-related differences in brain and specific abilities: Hormones,
developmental dynamics and new paradigm. In P. A. Vernon (Ed.) The
neuropsychology of individual differences. (pp. 59-113). London: Academic Press
INC.
Savage-McGlynn, E. (2012). Sex
differences in intelligence in younger and older participants of the Raven’s
Standard Progressive Matrices Plus. Personality and Individual Differences,
53(2), 137–141. http://doi.org/10.1016/j.paid.2011.06.013
Stoet, G., & Geary, D. C.
(2013). Sex Differences in Mathematics and Reading Achievement Are Inversely
Related: Within- and Across-Nation Assessment of 10 Years of PISA Data. PLoS
ONE, 8(3), e57988. http://doi.org/10.1371/journal.pone.0057988
Vogel, S. (1990). Gender
differences in intelligence, language, visuo-motor abilities and academic
achivement in students with learning disabilities: a review of the literature.
Journal of Learning Disability, 23, 44-52.
Voyer, D. (2011). Time limits and
gender differences on paper-and-pencil tests of mental rotation: a
meta-analysis. Psychonomic Bulletin & Review, 18(2), 267–277. http://doi.org/10.3758/s13423-010-0042-0
Wai, J., Cacchio, M., Putallaz,
M., & Makel, M. C. (2010). Sex differences in the right tail of cognitive
abilities: A 30year examination. Intelligence, 38(4), 412–423.
http://doi.org/10.1016/j.intell.2010.04.006
Wechsler, D. (1981). Manual for
the Wechsler Adult Intelligence Scale — Revised. New York, NY: Psychological
Corporation.
Free from Herpes just in 2 weeks
ReplyDeleteThe best herbal remedy
You can contact him
r.buckler11 {{@gmail}} com,, .......
dfg67dddf2
ReplyDeletegolden goose outlet
golden goose outlet
golden goose outlet
golden goose outlet
golden goose outlet
golden goose outlet
golden goose outlet
golden goose outlet
golden goose outlet
golden goose outlet